Smart irrigation
Apply the water you need, when you need it, using data from the soil itself.
- Moisture at 2 or 3 depths
- A reading every 15 minutes
- Alerts for excess and depletion
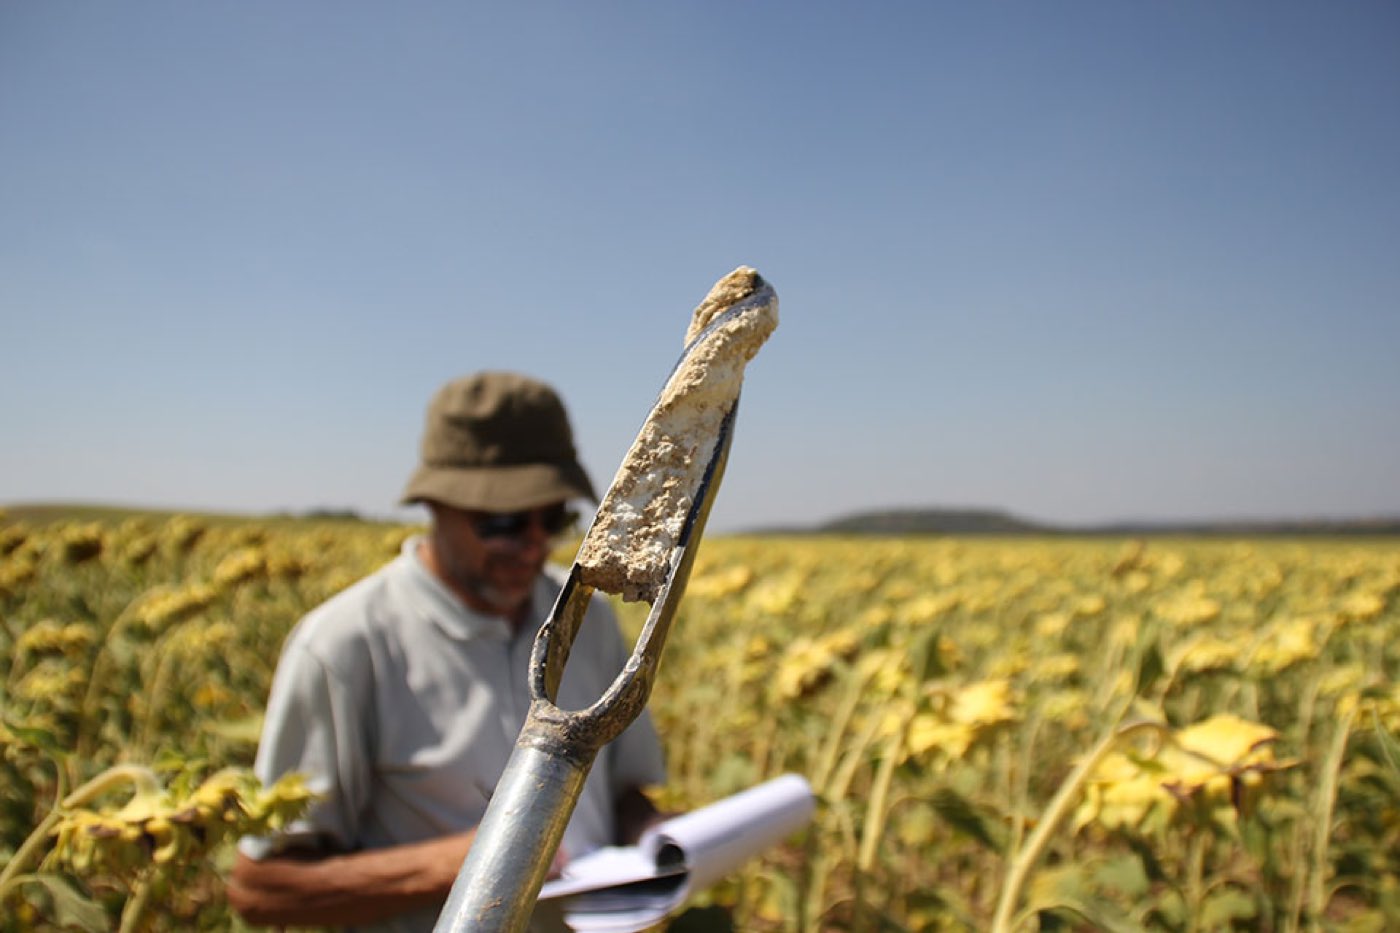
We install control points that measure the water left in your soil, at the depth where the roots are. Every morning you know whether to irrigate, how much, and how far down it reaches.
Apply the water you need, when you need it, using data from the soil itself.

Weather data from your own land, not from the next village.
The spatial variability of your plots, before installing anything.

Where everything the three control points measure ends up.
The first three measure in the field and can be installed separately or combined. Agzoom is the screen where you read them.
Where to place the probe, at what depth, and what its reading means. That does not come in the box with the sensor.
Soil that looks wet on the surface can be dry where it matters. And soil that looks dry can hold plenty of reserve at 60 cm.
Over-irrigating washes fertiliser below the root zone and suffocates the roots. Under-irrigating holds back fruit size exactly when the crop is building it. Between the two there is a narrow margin, and you cannot see it from the tractor.
Our job is to measure it: probes placed according to the real variability of your plot, at the depths the roots occupy, reading every 15 minutes.
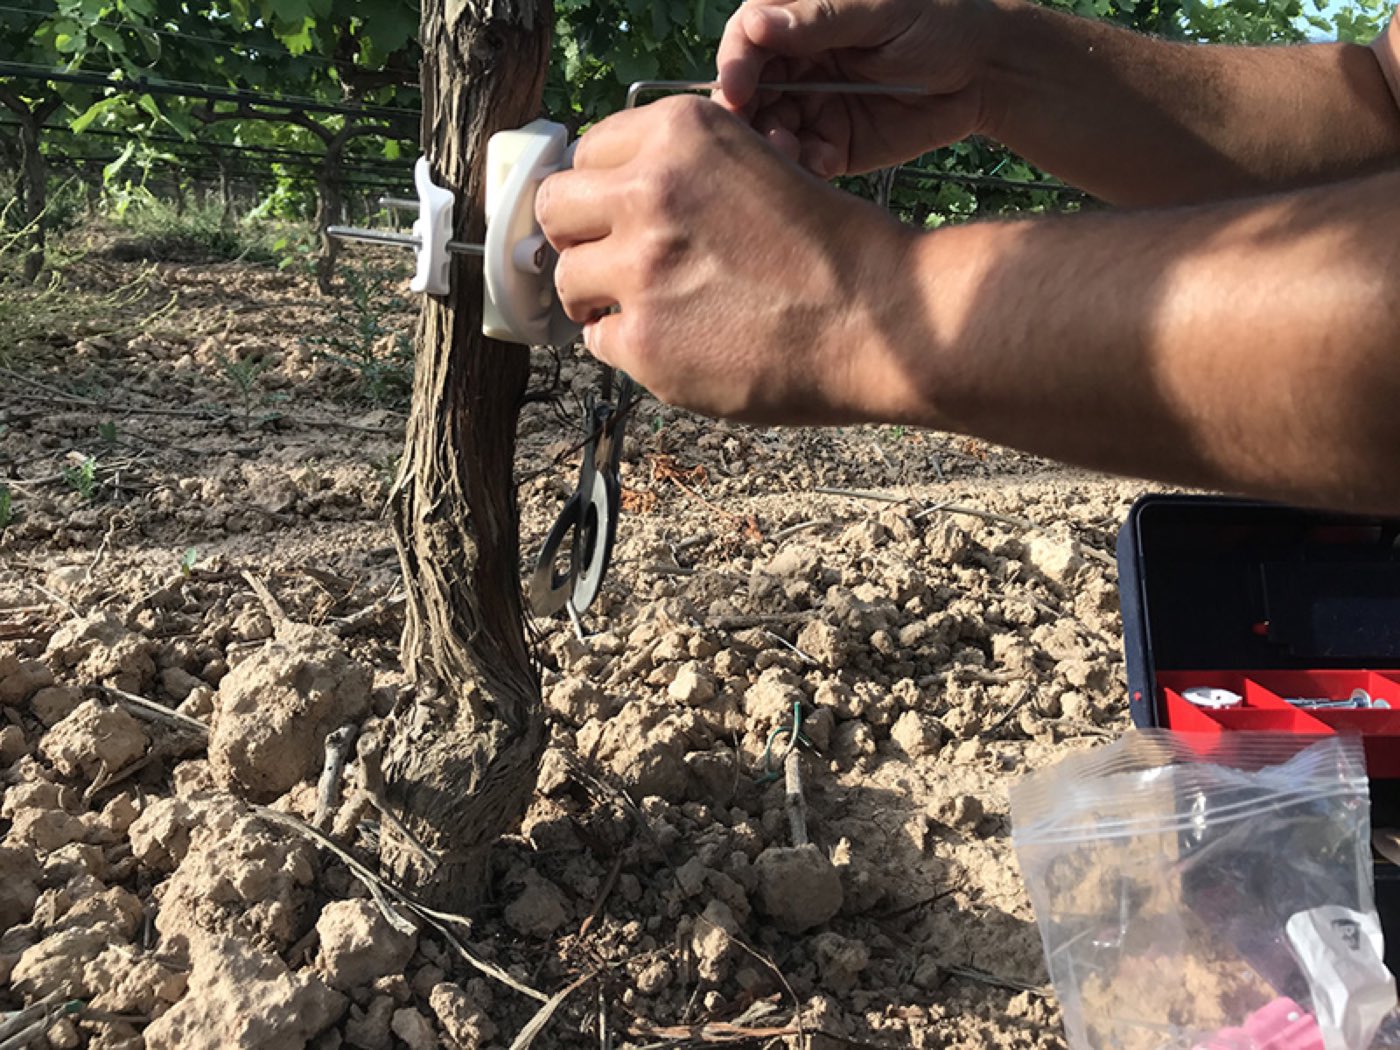
All of them use technology validated in field conditions, not in a catalogue.
Irrigation
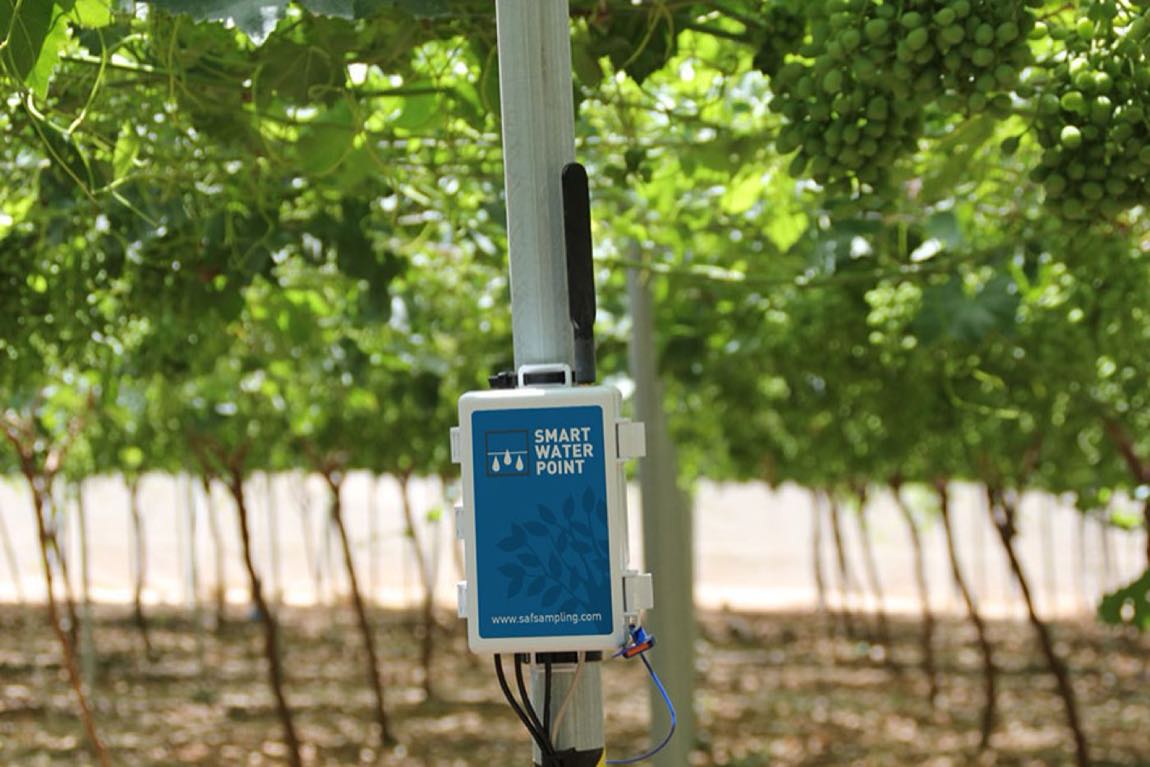
Moisture and temperature probes installed at the depth of the active root, sending data continuously. The simple, robust way to manage irrigation water.
 Weather
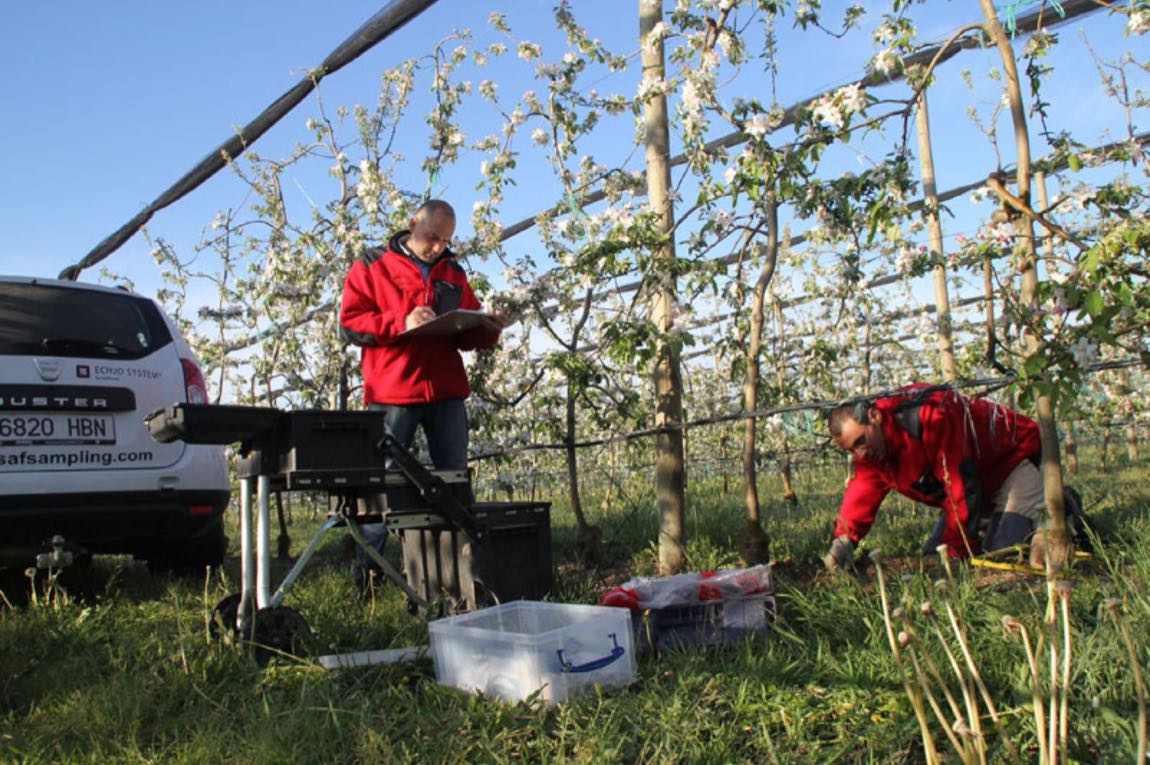
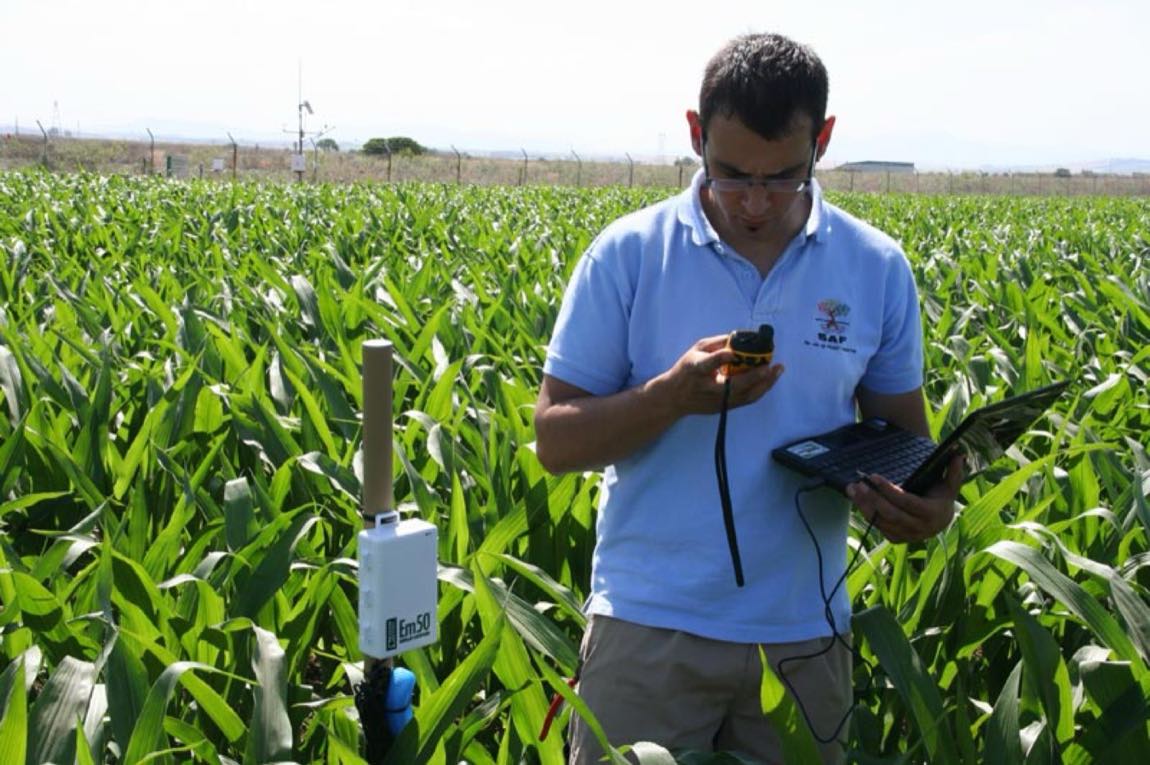
A station on your own land, with the indices already worked out. Knowing when there is real pest or frost risk is worth more than the general regional forecast.
 Soil
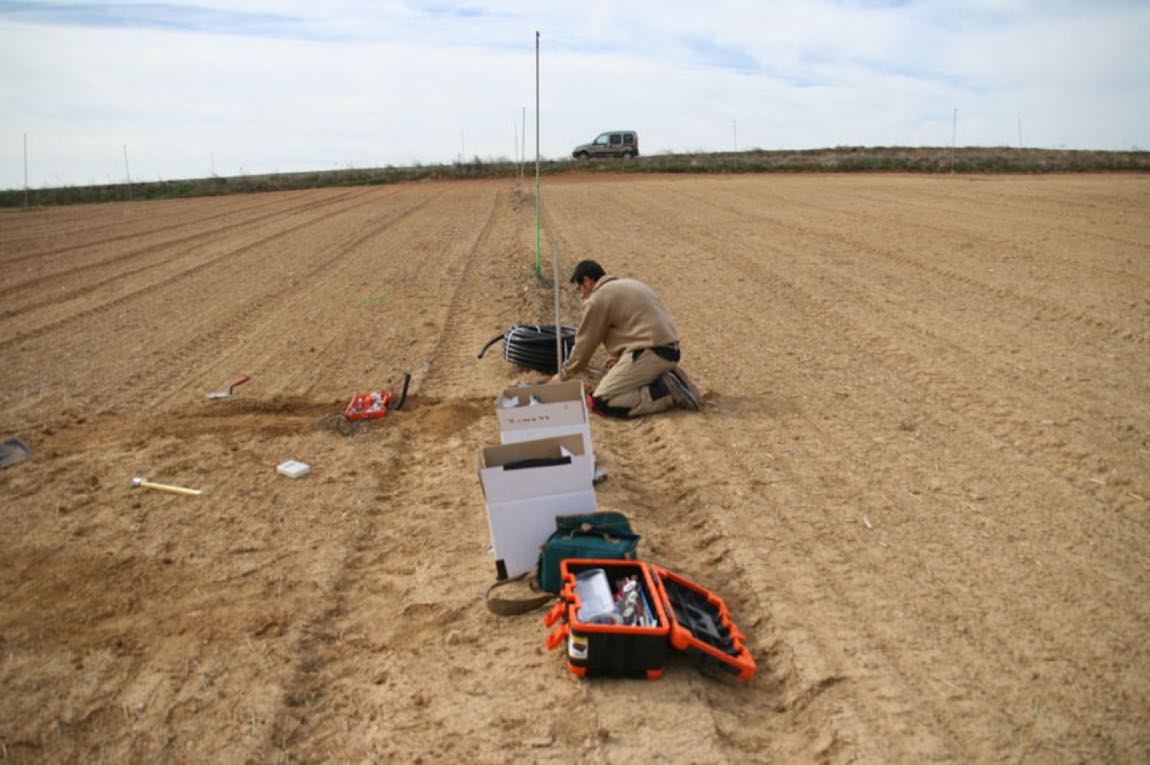
The spatial variability of the plot drives how you manage irrigation and fertilisation. It also decides where a control point makes sense and where it does not.
Three depths, the crop's comfort window and the irrigation applied, all on the same timeline. If the −60 cm line does not rise after irrigating, the water is not reaching the bottom.
La Plana farm · Verdú (Lleida) · Table grapes · SWP-04
No sensor goes in before we understand the soil underneath.
We come to the farm. Soil pit, texture, effective rooting depth and plot variability. That is what decides where each probe goes, and how deep.
Equipment proven in field conditions, not in a catalogue. Our own protocol, refined over more than a thousand installations. It is up and running the same day.
Interpretation, validation and modelling of the readings throughout the season. An agronomist looks at your data; the dashboard is only the tool.
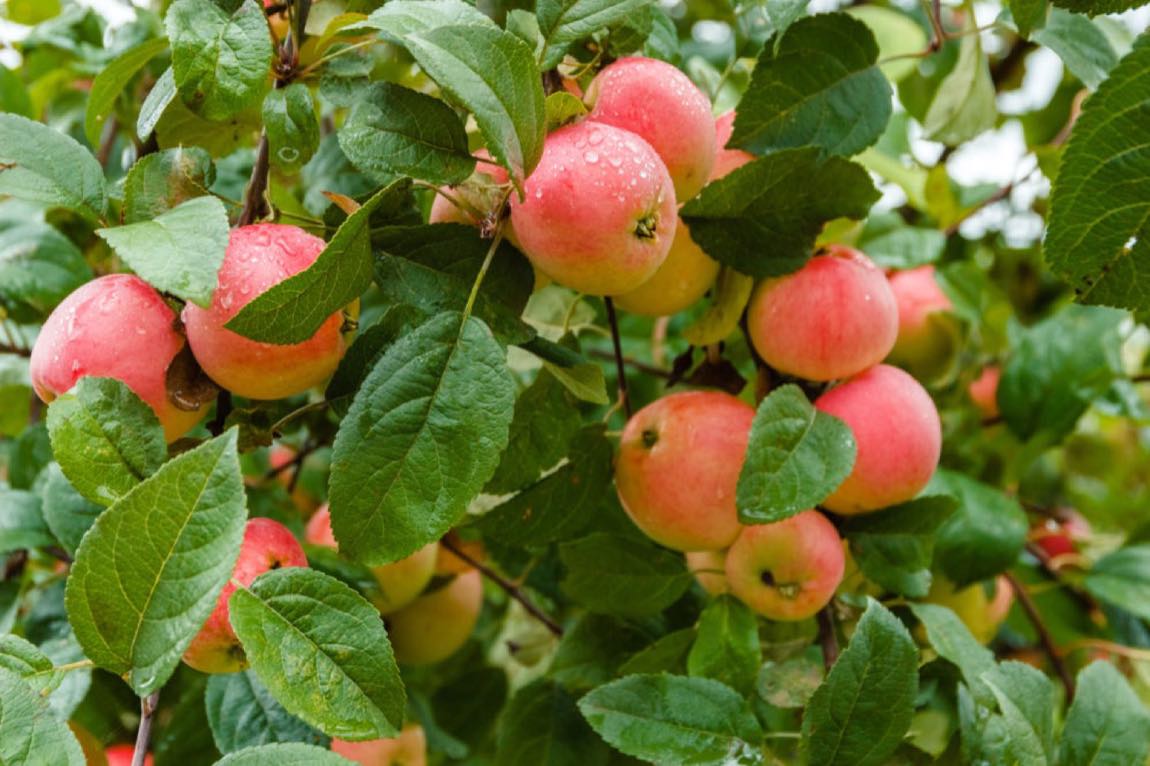
The probe is the same one. What changes is the depth, the threshold and when to push or ease off.
Water stress control at fruit set and veraison, so you lose neither size nor sugar.
Controlled deficit irrigation without mortgaging next year's crop.
When to apply the last irrigation, and how much reserve is left in the profile before closing the season.
Short cycles and high-frequency irrigation: here decisions are made by the hour, not by the day.
Checking that the wetted bulb reaches the root and is not lost below it.
Water requirements by growth stage, chill hours and frost risk warnings.
“We had been irrigating by calendar for years. Our first summer with the probes we cut out two whole irrigations and the fruit came out bigger. What convinced me was not the chart: it was the call in July telling us the water was not going down.”Client name · Farm and town · Table grapes, 18 ha
less water applied than the previous season, with the same yield.
In one visit we assess which solution fits your farm best. No commitment, and you get a written recommendation even if you install nothing.